|
Akoya Biosciences
opal polaris 7 color manual ihc detection kit Opal Polaris 7 Color Manual Ihc Detection Kit, supplied by Akoya Biosciences, used in various techniques. Bioz Stars score: 96/100, based on 1 PubMed citations. ZERO BIAS - scores, article reviews, protocol conditions and more https://www.bioz.com/product/multiplex+immunofluorescence+staining+kit/pm40316546-258-12-20?v=Akoya+Biosciences Average 96 stars, based on 1 article reviews
opal polaris 7 color manual ihc detection kit - by Bioz Stars,
2026-07
96/100 stars
|
Buy from Supplier |
|
Vector Laboratories
blocking reagents Blocking Reagents, supplied by Vector Laboratories, used in various techniques. Bioz Stars score: 96/100, based on 1 PubMed citations. ZERO BIAS - scores, article reviews, protocol conditions and more https://www.bioz.com/product/multiplex+immunofluorescence+staining+kit/bio_rxiv__2025__07__31__667081-474-32-34?v=Vector+Laboratories Average 96 stars, based on 1 article reviews
blocking reagents - by Bioz Stars,
2026-07
96/100 stars
|
Buy from Supplier |
|
Vircell S.L
multiplex respiratory pathogen igm test kit Multiplex Respiratory Pathogen Igm Test Kit, supplied by Vircell S.L, used in various techniques. Bioz Stars score: 90/100, based on 1 PubMed citations. ZERO BIAS - scores, article reviews, protocol conditions and more https://www.bioz.com/product/multiplex+immunofluorescence+staining+kit/pm39305165-77-5-11?v=Vircell+S.L Average 90 stars, based on 1 article reviews
multiplex respiratory pathogen igm test kit - by Bioz Stars,
2026-07
90/100 stars
|
Buy from Supplier |
|
Servicebio Inc
tsa based multiplex immunofluorescence kit Tsa Based Multiplex Immunofluorescence Kit, supplied by Servicebio Inc, used in various techniques. Bioz Stars score: 86/100, based on 1 PubMed citations. ZERO BIAS - scores, article reviews, protocol conditions and more https://www.bioz.com/product/multiplex+immunofluorescence+staining+kit/bio_rxiv__64898__2026__01__31__693596-337-11-15?v=Servicebio+Inc Average 86 stars, based on 1 article reviews
tsa based multiplex immunofluorescence kit - by Bioz Stars,
2026-07
86/100 stars
|
Buy from Supplier |
|
Boster Bio
ccl2 elisa kits  Ccl2 Elisa Kits, supplied by Boster Bio, used in various techniques. Bioz Stars score: 93/100, based on 1 PubMed citations. ZERO BIAS - scores, article reviews, protocol conditions and more https://www.bioz.com/product/multiplex+immunofluorescence+staining+kit/pmc10001412-74-24-31?v=Boster+Bio Average 93 stars, based on 1 article reviews
ccl2 elisa kits - by Bioz Stars,
2026-07
93/100 stars
|
Buy from Supplier |
|
Elabscience Biotechnology
human apoe elisa kit  Human Apoe Elisa Kit, supplied by Elabscience Biotechnology, used in various techniques. Bioz Stars score: 93/100, based on 1 PubMed citations. ZERO BIAS - scores, article reviews, protocol conditions and more https://www.bioz.com/product/multiplex+immunofluorescence+staining+kit/pmc12307935-537-0-9?v=Elabscience+Biotechnology Average 93 stars, based on 1 article reviews
human apoe elisa kit - by Bioz Stars,
2026-07
93/100 stars
|
Buy from Supplier |
|
Diagnostic Hybrids Inc
multiplex direct immunofluorescence assay kit Multiplex Direct Immunofluorescence Assay Kit, supplied by Diagnostic Hybrids Inc, used in various techniques. Bioz Stars score: 90/100, based on 1 PubMed citations. ZERO BIAS - scores, article reviews, protocol conditions and more https://www.bioz.com/product/multiplex+immunofluorescence+staining+kit/pm38977804-81-7-12?v=Diagnostic+Hybrids+Inc Average 90 stars, based on 1 article reviews
multiplex direct immunofluorescence assay kit - by Bioz Stars,
2026-07
90/100 stars
|
Buy from Supplier |
|
R&D Systems
human thbs2 elisa kit  Human Thbs2 Elisa Kit, supplied by R&D Systems, used in various techniques. Bioz Stars score: 94/100, based on 1 PubMed citations. ZERO BIAS - scores, article reviews, protocol conditions and more https://www.bioz.com/product/multiplex+immunofluorescence+staining+kit/pm34958892-131-69-74?v=R%26D+Systems Average 94 stars, based on 1 article reviews
human thbs2 elisa kit - by Bioz Stars,
2026-07
94/100 stars
|
Buy from Supplier |
|
Miltenyi Biotec
cd34 microbead kit  Cd34 Microbead Kit, supplied by Miltenyi Biotec, used in various techniques. Bioz Stars score: 96/100, based on 1 PubMed citations. ZERO BIAS - scores, article reviews, protocol conditions and more https://www.bioz.com/product/multiplex+immunofluorescence+staining+kit/pmc09505374-17-0-6?v=Miltenyi+Biotec Average 96 stars, based on 1 article reviews
cd34 microbead kit - by Bioz Stars,
2026-07
96/100 stars
|
Buy from Supplier |
|
Akoya Biosciences
opal 6 plex manual detection kit akoya biosciences Opal 6 Plex Manual Detection Kit Akoya Biosciences, supplied by Akoya Biosciences, used in various techniques. Bioz Stars score: 96/100, based on 1 PubMed citations. ZERO BIAS - scores, article reviews, protocol conditions and more https://www.bioz.com/product/multiplex+immunofluorescence+staining+kit/pm39933899-333-13-18?v=Akoya+Biosciences Average 96 stars, based on 1 article reviews
opal 6 plex manual detection kit akoya biosciences - by Bioz Stars,
2026-07
96/100 stars
|
Buy from Supplier |
|
Abcam
picrosirius red staining 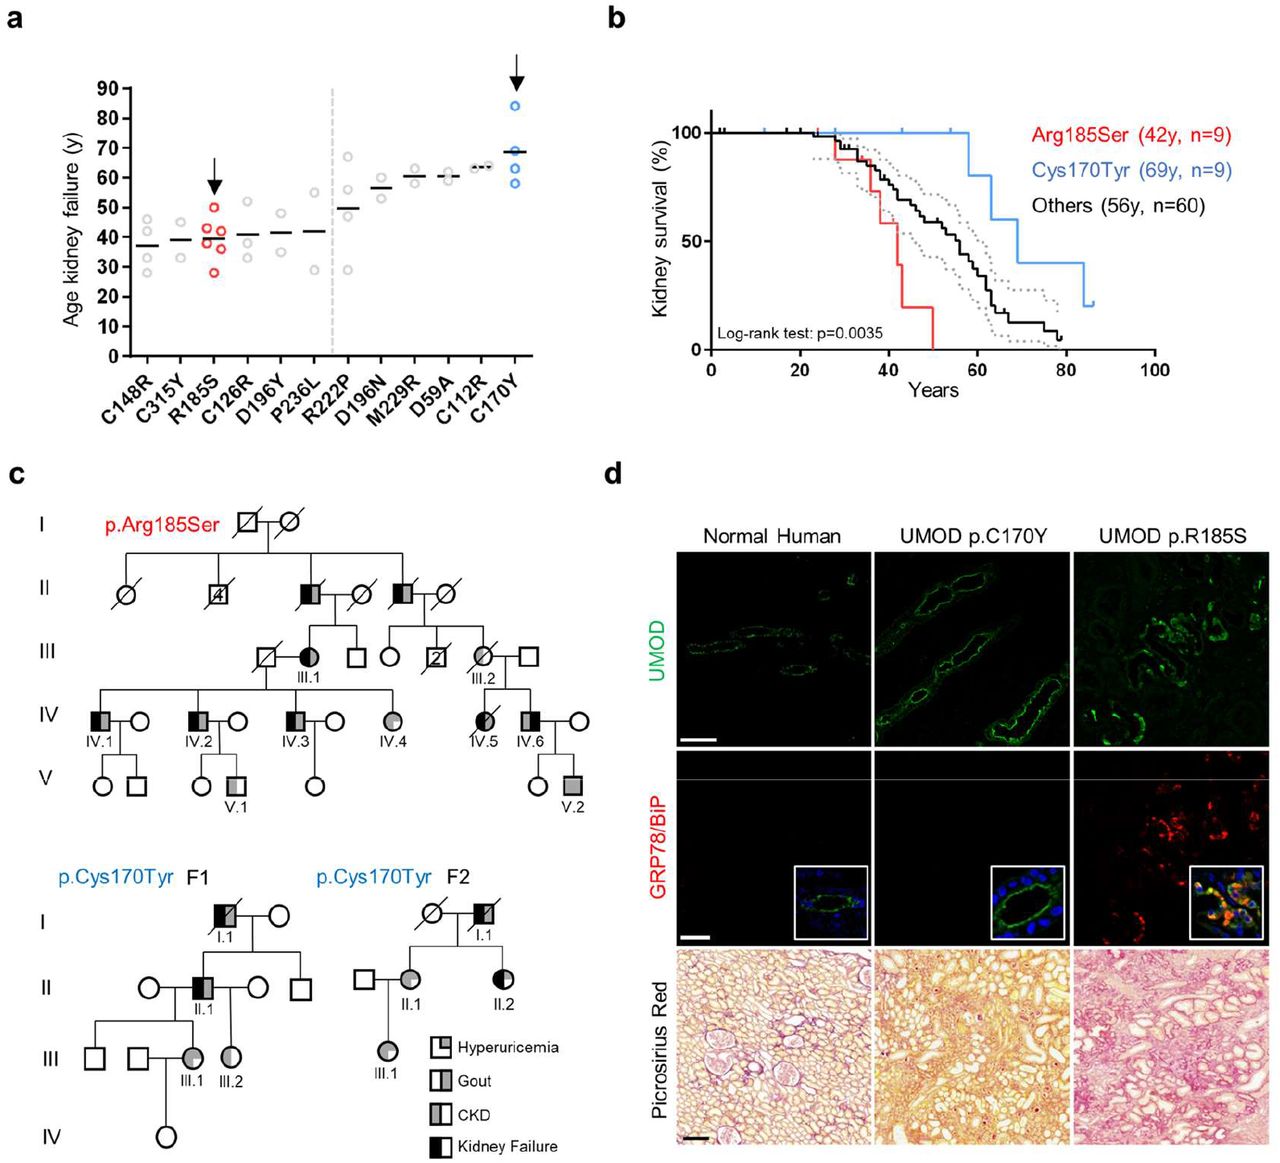 Picrosirius Red Staining, supplied by Abcam, used in various techniques. Bioz Stars score: 99/100, based on 1 PubMed citations. ZERO BIAS - scores, article reviews, protocol conditions and more https://www.bioz.com/product/multiplex+immunofluorescence+staining+kit/bio_rxiv__2022__09__13__507770-181-0-4?v=Abcam Average 99 stars, based on 1 article reviews
picrosirius red staining - by Bioz Stars,
2026-07
99/100 stars
|
Buy from Supplier |
|
New England Biolabs
socs1 mutants  Socs1 Mutants, supplied by New England Biolabs, used in various techniques. Bioz Stars score: 99/100, based on 1 PubMed citations. ZERO BIAS - scores, article reviews, protocol conditions and more https://www.bioz.com/product/multiplex+immunofluorescence+staining+kit/pmc07578789-261-2-13?v=New+England+Biolabs Average 99 stars, based on 1 article reviews
socs1 mutants - by Bioz Stars,
2026-07
99/100 stars
|
Buy from Supplier |
Image Search Results
Journal: Cancers
Article Title: Cancer-Associated Fibroblasts Exposed to High-Dose Ionizing Radiation Promote M2 Polarization of Macrophages, Which Induce Radiosensitivity in Cervical Cancer
doi: 10.3390/cancers15051620
Figure Lengend Snippet: CCL2 is critical for high-dose irradiated CAFs to promote M2 polarization. ( A ) mCAFs were exposed to 8 Gy radiation or not (control), and the supernatant of mCAFs was subjected to multiplex cytokine array analysis 24 h later. Left: a representative blot. Right: quantification of dot intensity of significantly changed cytokines. ( B ) Cervical cancer cell lines and CAFs were irradiated with the indicated doses. After 24 h, CCL2 expression was analyzed by Western blot analysis. ( C ) mCAFs and hCAFs were exposed to the indicated doses of radiation. After 24 h, the supernatant was subjected to ELISA. Data are shown as mean ± SD from three independent experiments. The data were analyzed using one-way ANOVA. * p < 0.05, ** p < 0.01, *** p < 0.001. ( D ) BMDMs were treated with 20 ng/mL CCL2 for 24 h and then subjected to flow cytometry analysis. Data are shown as mean ± SD from three independent experiments. Differences between groups were analyzed using unpaired Student’s t -test. * p < 0.05. ( E ) M0 BMDMs treated with 10 nM CCR2 antagonist (INCB3344) were co-cultured with irradiated or non-irradiated mCAFs for 3 days. Then, the cells were subjected to flow cytometry analysis to evaluate CD206 expression. Data are shown as mean ± SD from three independent experiments. * p < 0.05. ( F ) Anti-CCL2 neutralizing antibody (20 μg/mL) was added to a co-culture system consisting of 8 Gy irradiated mCAFs and M0 BMDMs. The BMDMs were subjected to flow cytometry analysis after 3 days of co-cultivation. Data are shown as mean ± SD from three independent experiments. The data were analyzed using one-way ANOVA. * p < 0.05. ( G ) M0 BMDMs were co-cultured with mCAFs exposed to the indicated doses of radiation for 3 days and 10 nM CCR2 antagonist (INCB3344) was added into the 8 Gy irradiated mCAF co-culture system. Immunofluorescence analysis of the expression of Ym-1 (red) in BMDMs. The whole western blots are shown in File S1.
Article Snippet: The supernatant of CAFs and cervical cancer cells was assayed for cytokines and chemokines using the Mouse XL Cytokine Array (Ary028; R&D Systems) and
Techniques: Irradiation, Control, Multiplex Assay, Expressing, Western Blot, Enzyme-linked Immunosorbent Assay, Flow Cytometry, Cell Culture, Co-Culture Assay, Immunofluorescence

Journal: Cancers
Article Title: Cancer-Associated Fibroblasts Exposed to High-Dose Ionizing Radiation Promote M2 Polarization of Macrophages, Which Induce Radiosensitivity in Cervical Cancer
doi: 10.3390/cancers15051620
Figure Lengend Snippet: Model summarizing the proposed signaling events among CAFs, TAMs, and cervical cancer cells under high-dose radiation. CAFs secrete an elevated level of CCL2 upon treatment with high-dose radiation. CCL2 promotes pro-tumor transition in macrophages. M2 macrophages induce radioresistance in cervical cancer cells.
Article Snippet: The supernatant of CAFs and cervical cancer cells was assayed for cytokines and chemokines using the Mouse XL Cytokine Array (Ary028; R&D Systems) and
Techniques:
Journal: Nature Communications
Article Title: AR + TREM2 + macrophage induced pathogenic immunosuppression promotes prostate cancer progression
doi: 10.1038/s41467-025-62381-x
Figure Lengend Snippet: a Experimental scheme of mass spectrometry. Created in BioRender. Qiaohua, W. (2025) https://BioRender.com/ly3agho . Briefly, proteins from human prostate tumour tissues were extracted, followed by immunoprecipitation using anti-TREM2 antibody or IgG and agarose beads, and then the enriched proteins were lysed for peptide identification. b Venn diagram and the table showing the secretory proteins in the anti-TREM2-enriched complex. c Pearson correlation analysis of APOE and TREM2 mRNA levels in TCGA database of prostate cancer ( n = 498 biologically independent samples). d Representative immunoblot analysis of TREM2 and APOE in macrophages isolated from human prostate cancer tissues which was immunoprecipitated with anti-TREM2 antibody. Sample processing controls (lysate input, run on the same separate gel) are shown in panel (1 & 2). Experiment was repeated three times independently with similar results. e Representative multiplex immunofluorescence staining images of TREM2, APOE, and CD206 in prostate tumour tissues and adjacent normal prostate tissues. Nuclei were stained with DAPI. Scale bar: 10 μm. f Quantification of co-expression, singular expression, and non-expression of TREM2 and APOE in CD68-expressing cells in tumour regions and distant normal prostate tissues ( n = 5 biologically independent samples) from multiplex immunofluorescence of (Fig. 3e). g The concentration of APOE in the serum of both healthy individuals ( n = 12 biologically independent samples) and patients ( n = 28 biologically independent samples) with prostate cancer was detected using ELISA. h The concentration of APOE in the homogenates of normal prostate and prostate cancer tissues was detected using ELISA ( n = 6 biologically independent samples). i The concentration of APOE in normal cell culture media and RM1 CM was measured using ELISA ( n = 6 biologically independent samples). j Representative immunoblot analysis of AR, TREM2, p-STAT3, ROR-γ, p-Src, and p-Syk in WT BMDMs, TREM2 KO BMDMs and DAP12 KO BMDMs treated with RM1 CM or 100 nM recombinant APOE protein for 48 h. Experiment was repeated three times independently with similar results. k Representative immunoblot analysis of AR, TREM2, p-STAT3, ROR-γ, p-Src, and p-Syk in WT BMDMs treated with RM1 CM or RM1 CM plus 1 ng/ml anti-APOE for 48 h. Experiment was repeated three times independently with similar results. l , m RT-qPCR analysis of in WT BMDMs and TREM2 KO BMDMs treated with 100 nM recombinant APOE protein ( l ) or RM1 CM plus 1 ng/ml anti-APOE ( m ) for 48 h ( n = 6 biologically independent samples). Gene expression was normalized to Actb expression. For e, experiments were repeated three times independently with similar results. All the data are presented as mean ± SD. The P -values were determined by two-sided Pearson correlation analysis for ( c ); by two-way ANOVA with Sidak’s multiple comparisons for ( f ); by two-sided Mann-Whitney U test for ( g − i ); and by two-way ANOVA with Tukey’s multiple comparisons for ( l , m ). Source data are provided as a Source Data file.
Article Snippet:
Techniques: Mass Spectrometry, Immunoprecipitation, Western Blot, Isolation, Multiplex Assay, Immunofluorescence, Staining, Expressing, Concentration Assay, Enzyme-linked Immunosorbent Assay, Cell Culture, Recombinant, Quantitative RT-PCR, Gene Expression, MANN-WHITNEY

Journal: Nature Communications
Article Title: AR + TREM2 + macrophage induced pathogenic immunosuppression promotes prostate cancer progression
doi: 10.1038/s41467-025-62381-x
Figure Lengend Snippet: a Schematic representation of TREM2 +/+ and TREM2 -/- BMDMs induction. Created in BioRender. Qiaohua, W. (2025) https://BioRender.com/ly3agho . BMDMs were treated with RM1 CM plus 10 μM ENZA, and gene expression was analysed by RT-qPCR and protein expression by flow cytometry. b RT-qPCR analysis of M2-like macrophage markers Il10 and Tgfb1 in WT BMDMs and TREM2 KO BMDMs treated with RM1 CM plus 10 μM ENZA for 48 h ( n = 6 biologically independent samples). Gene expression was normalized to Actb expression. c ELISA analysis of IL-10 and TGF-β in the supernatant of WT BMDMs and TREM2 KO BMDMs treated with RM1 CM plus 10 μM ENZA for 48 h ( n = 5 biologically independent samples). d , e Representative flow plots and quantification of CD206 ( d ) and CD86 ( e ) in WT BMDMs and TREM2 KO BMDMs treated with RM1 CM plus 10 μM ENZA for 48 h ( n = 5 biologically independent samples). f A genomic view of AR enrichment on IL10 and TGFB1 promoters in THP-1 cells was analysed from published ChIP-seq data . AR peaks under DMSO and 10 nM R1881 conditions are depicted in blue and red, respectively. g Prediction of Ar binding sites on the Il10 (left) and Tgfb1 (right) promoters through the JASPAR database. h The specific binding of Ar to the predicted binding site in Il10 and Tgfb1 promoters in WT BMDMs treated with RM1 CM was detected by ChIP-qPCR ( n = 6 biologically independent samples). i The binding of Ar to the Il10 and Tgfb1 promoters in WT BMDMs and TREM2 KO BMDMs treated with RM1 CM was detected by ChIP-qPCR ( n = 6 biologically independent samples). Relative fold enrichment was normalised relative to IgG and WT BMDM group, respectively. j The binding of Ar to the Il10 and Tgfb1 promoters in WT BMDMs treated with RM1 CM plus 10 μM ENZA for 48 h was detected by ChIP-qPCR ( n = 6 biologically independent samples). Relative fold enrichment was normalised relative to IgG and CTL group, respectively. All the data are presented as mean ± SD. The P -values were determined by two-way ANOVA with Tukey’s multiple comparisons for ( b − d ); by two-way ANOVA with Sidak’s multiple comparisons for ( h ); and by two-sided Mann-Whitney U test for ( i , j ). Source data are provided as a Source Data file.
Article Snippet:
Techniques: Gene Expression, Quantitative RT-PCR, Expressing, Flow Cytometry, Enzyme-linked Immunosorbent Assay, ChIP-sequencing, Binding Assay, ChIP-qPCR, MANN-WHITNEY

Journal: Nature Communications
Article Title: AR + TREM2 + macrophage induced pathogenic immunosuppression promotes prostate cancer progression
doi: 10.1038/s41467-025-62381-x
Figure Lengend Snippet: a , b Assessment of the indirect antitumour effects of BMDMs. WT BMDMs and TREM2 KO BMDMs were co-cultured with RM1 cells at a ratio of 1:1 in Transwell systems with 10 μM ENZA. a RT-qPCR was performed to detect the mRNA levels of Ki67 in RM1 cells after 48 h of co-culture ( n = 6 biologically independent samples). b Representative images and quantification of migrated RM1 cells were obtained after 24 h of co-culture ( n = 5 biologically independent samples). c , d WT BMDMs and TREM2 KO BMDMs were co-cultured with RM1 cells at a ratio of 1:1 in Transwell systems with 100 nM recombinant APOE protein. c RT-qPCR was performed to detect the mRNA levels of Ki67 in RM1 cells after 48 h of co-culture ( n = 6 biologically independent samples). d Representative images and quantification of migrated RM1 cells were obtained after 24 h of co-culture ( n = 5 biologically independent samples). e RT-qPCR analysis of pro-migratory cytokines Ccl2 and pro-proliferative cytokine Il23a in WT BMDMs and TREM2 KO BMDMs co-cultured with RM1 cells plus 10 μM ENZA for 48 h ( n = 6 biologically independent samples). Gene expression was normalized to Actb expression. f Representative images of Transwell migration assays (with three technical replicates) of RM1 cells cultured in normal medium alone or co-cultured with WT BMDMs at a ratio of 1:1, or co-cultured with WT BMDMs and treated with 1 ug/ml blocking antibodies against CCL2, CCL7, and CCL13. Cells that penetrated the membrane after 24 h of culture were stained using crystal violet. The migration ability of the cells was quantified using the optical density (OD) of the crystal violet-stained cells ( n = 3 independent experiments). The schematics in ( a − d , f ) are created in Biorender. Qiaohua, W. (2025) https://BioRender.com/ly3agho . g WT BMDMs were co-cultured with RM1 cells at a ratio of 1:1 plus blocking antibody against Ki67 in Transwell systems for 48 h, RT-qPCR was performed to detect the mRNA levels of Ki67 in RM1 cells ( n = 6 biologically independent samples). h ELISA analysis of CCL2 and IL-23 in the supernatant of WT BMDMs and TREM2 KO BMDMs treated with RM1 CM plus 10 μM ENZA for 48 h ( n = 5 biologically independent samples). i A genomic view of AR enrichment on IL23A and CCL2 promoters in THP-1 cells was analysed from published ChIP-seq data . AR peaks under DMSO and 10 nM R1881 conditions are depicted in blue and red, respectively. j Prediction of AR binding sites on the Ccl2 (left) and Il23a (right) promoters through the JASPAR database. k The specific binding of Ar to the predicted binding site in Ccl2 and Il23a promoters in WT BMDMs treated with RM1 CM was detected by ChIP-qPCR ( n = 6 biologically independent samples). l The binding of Ar to the Ccl2 and Il23a promoters in WT BMDMs and TREM2 KO BMDMs treated with RM1 CM was detected by ChIP-qPCR ( n = 6 biologically independent samples). Relative fold enrichment was normalised relative to IgG and WT BMDM group, respectively. m The binding of Ar to the Ccl2 and Il23a promoters in WT BMDMs treated with RM1 CM plus 10 μM ENZA for 48 h was detected by ChIP-qPCR ( n = 6 biologically independent samples). Relative fold enrichment was normalised relative to IgG and CTL group, respectively. All the data are presented as mean ± SD. The P -values were determined by two-way ANOVA with Tukey’s multiple comparisons for ( a − e , h ); by two-way ANOVA with Sidak’s multiple comparisons for ( k ); by one-way ANOVA with Tukey’s multiple comparisons for ( f ); and by two-sided Mann-Whitney U test for ( g − m ). Source data are provided as a Source Data file.
Article Snippet:
Techniques: Cell Culture, Quantitative RT-PCR, Co-Culture Assay, Recombinant, Gene Expression, Expressing, Migration, Blocking Assay, Membrane, Staining, Enzyme-linked Immunosorbent Assay, ChIP-sequencing, Binding Assay, ChIP-qPCR, MANN-WHITNEY

Journal: Nature Communications
Article Title: AR + TREM2 + macrophage induced pathogenic immunosuppression promotes prostate cancer progression
doi: 10.1038/s41467-025-62381-x
Figure Lengend Snippet: a Box plot depicting AR (left), TREM2 (medium) and APOE (right) expression in TCGA bulk RNA-seq samples of human normal prostate ( n = 152 biologically independent samples) and prostate cancer samples (PRAD, n = 492 biologically independent samples) from GEPIA database. Box plots show the median (centre line), 25th and 75th percentiles (box bounds), and whiskers extend to the 5th and 95th percentiles which represent minima and maxima. b Disease-free survival based on AR, TREM2 and APOE expression in primary prostate tumours (TCGA) from GEPIA database. the High AR (left) /TREM2 (medium) /APOE (right) group (red) ( n = 246 biologically independent samples) corresponds to the first 50% of expression, and the Low AR (left) /TREM2 (medium) /APOE (right) group (blue) ( n = 246 biologically independent samples) corresponds to the last 50% of expression. c Experimental scheme. Created in BioRender. Qiaohua, W. (2025) https://BioRender.com/ly3agho . C57BL/6 TREM2 f/f and TREM2 f/f -Lyz2-cre mice were subjected to subcutaneous injections of RM1-Luc cells in the inguinal region. Surgical castration (CTX) was performed after 3 days. ENZA treatment commenced on day five. Mice were euthanized on day 15 for analysis and data collection. The sham group for each genotype serves as its own control. RM1-Luc: luciferase-tagged RM1, s.c.: subcutaneous, CTX: Castration, ENZA: Enzalutamide. d − f Representative prostate tumour size ( n = 5 mice) ( d ), tumour weight ( n = 6 mice) ( e ), and tumour growth curve ( n = 5 mice) ( f ) of each group. g The proportion of CD45 + CD11b + F4/80 + macrophages in the tumour were quantified by flow cytometry ( n = 5 mice). h The proportion of CD11b + F4/80 + CD206 + (left) macrophages and CD11b + F4/80 + CD86 + (right) macrophages in the tumour were quantified by flow cytometry ( n = 5 mice). i ELISA assay was employed to quantify the protein levels of IL-10 and TGF-β in the tumour griding supernatant of tumour-bearing mice ( n = 5 mice). j The proportion of CD45 + CD3 + CD8 + T cells in the tumour was quantified by flow cytometry ( n = 5 mice). k The number of PD1 + CD8 + T cells mg -1 in the tumour ( n = 5 mice). l The number of IFN-γ + CD8 + T cells mg -1 (left) and TNF + CD8 + T cells mg -1 (right) in the tumour ( n = 5 mice). m The proportion of granzyme B (left) and perforin (right) in the intraprostatic CD8 + T cells of tumour-bearing mice ( n = 5 mice). (n) Experimental scheme. Created in BioRender. Qiaohua, W. (2025) https://BioRender.com/ly3agho . C57BL/6 TREM2 f/f and TREM2 f/f -Lyz2-cre mice were subjected to subcutaneous injections of RM1 cells in the inguinal region. Surgical castration (CTX) was performed after 3 days. ENZA and anti-PD1 treatment commenced on day five. Mice were euthanized on day 15 for analysis and data collection. o , p Representative prostate tumour size ( n = 6 mice) ( o ), and tumour weight ( n = 6 mice) ( p ) of each group. All the data are presented as mean ± SD. The P -values were determined by two-sided Mann-Whitney U test for ( a ); by Log-rank (Mantel-Cox) test for ( b ); by two-way ANOVA with Tukey’s multiple comparisons for ( f ); and by one-way ANOVA with Tukey’s multiple comparisons for ( e , g − m , p ). Source data are provided as a Source Data file.
Article Snippet:
Techniques: Expressing, RNA Sequencing, Control, Luciferase, Flow Cytometry, Enzyme-linked Immunosorbent Assay, MANN-WHITNEY

Journal: Nature Communications
Article Title: AR + TREM2 + macrophage induced pathogenic immunosuppression promotes prostate cancer progression
doi: 10.1038/s41467-025-62381-x
Figure Lengend Snippet: a Experimental scheme. Created in BioRender. Qiaohua, W. (2025) https://BioRender.com/ly3agho . Pten PC-/- TREM2 f/f and Pten PC-/- TREM2 f/f -Lyz2-cre mice were surgically castrated at week eight. ENZA was administrated 12 weeks after surgical castration when castration resistance was observed. Prostate tumour volume was monitored by magnetic resonance imaging (MRI) at weeks 12 and 24. Mice were euthanized at week 24 for analysis and data collection. CTX: Castration, ENZA: Enzalutamide, MRI: Magnetic resonance imaging. b Representative MRI scans of mice in each group at weeks 12 and 24. The red circle highlights the area of prostate carcinoma. c Waterfall plots depicting the proportional change in tumour response at weeks 12 and 24 ( n = 3 mice). d Representative haematoxylin and eosin (H&E) and Ki67 staining at the observation endpoint. Scale bar: 40 μm. e Quantitative analysis of adenocarcinoma, prostatic intraepithelial neoplasia (PIN), or normal-like glands at the observation endpoint in each group ( n = 3 mice). f Percentage of Ki-67 + cell area relative to total area ( n = 3 mice). g ELISA assay was employed to quantify the protein levels of IL-10 (left) and TGF-β (right) in tumour griding supernatant of mice ( n = 5 mice). h The proportion of CD45 + CD11b + F4/80 + macrophages in the tumour were quantified by flow cytometry ( n = 5 mice). i The proportion of CD11b + F4/80 + CD206 + (up) macrophages and CD11b + F4/80 + CD86 + (down) macrophages in the tumour were quantified by flow cytometry ( n = 5 mice). j The proportion of CD45 + CD3 - NK1.1 + NK cells in the tumour was quantified by flow cytometry ( n = 5 mice). k The proportion of CD45 + CD3 + CD8 + T cells in the tumour was quantified by flow cytometry ( n = 5 mice). l The number of PD1 + CD8 + T cells mg -1 in the tumour ( n = 5 mice). m The number of IFN-γ + CD8 + T cells mg -1 (left) and TNF + CD8 + T cells mg -1 (right) in the tumour ( n = 5 mice). n The number of Granzyme B + CD8 + T cells mg -1 (left) and Perforin + CD8 + T cells mg -1 (right) in the tumour ( n = 5 mice). For b and d, experiments were repeated three times independently with similar results. All the data are presented as mean ± SD. The P- values were determined by two-way ANOVA with Tukey’s multiple comparisons for (c, e); and by one-way ANOVA with Tukey’s multiple comparisons for ( f – n ). Source data are provided as a Source Data file.
Article Snippet:
Techniques: Magnetic Resonance Imaging, Staining, Enzyme-linked Immunosorbent Assay, Flow Cytometry
Journal: Cancer letters
Article Title: Tumor-stroma TGF-β1-THBS2 feedback circuit drives pancreatic ductal adenocarcinoma progression via integrin α v β 3 /CD36-mediated activation of the MAPK pathway.
doi: 10.1016/j.canlet.2021.12.025
Figure Lengend Snippet: Fig. 1. THBS2 was highly expressed in PDAC tissues and was positively associated with disease progression. (A) Five human PDAC tissue samples and paired adjacent normal pancreatic tissues were analyzed by TMT quantitative proteomics technology. Heatmap representing the differentially expressed proteins in human PDAC tissues (T) vs. adjacent normal tissues (N), in which data were sorted log2 (T/N fold change) ≥1 or ≤−1 and p < 0.05. (B) Bubble plot representing the significantly enriched cellular components according to GO enrichment analysis based on the 34 upregulated proteins in PDAC tissues. (C) Comparison of the fold change of 49 differentially expressed proteins in PDAC tissues vs. adjacent normal tissues (Up: 34 upregulated proteins in tumor tissues; Down: 15 downregulated proteins in tumor tissues). (D) The mRNA level of THBS2 in pancreatic cancer tissues (T) vs. normal pancreatic tissues (N) was confirmed by the GEPIA database (http://gepia.cancer-pku.cn/). (E, F) Kaplan–Meier overall survival curves and disease free survival curves for patients with low (blue) or high (red) expression of THBS2 mRNA in PDAC via GEPIA. (G) Immunohistochemical staining (IHC) of THBS2 protein expression in human PDAC tissues (T) and adjacent normal tissues (N). (H) Statistical data regarding the immunohistochemical score of THBS2 protein in PDAC tissues (T, n = 597) and adjacent normal tissues (N, n = 277). (I) Kaplan- Meier analyses of overall survival. Patients with high THBS2 expression (n = 111) had a significantly lower overall survival rate than patients with low THBS2 expression (n = 130). (J) THBS2 protein expression levels were significantly associated with AJCC stages, lymph node metastasis and distant metastasis. (K) THBS2 plasma concentration (ng/ml) in healthy controls (Normal), early (I-IIA) and advanced (IIB-IV) stages of PDAC patients. Ns: not significant; *p < 0.05; **p < 0.01; ***p < 0.001 and ****p < 0.0001. (For interpretation of the references to color in this figure legend, the reader is referred to the Web version of this article.)
Article Snippet: Cells were grown in a 6-cm cell culture dish (2 × 10⁶) for 24 h, and then, the cell medium was replaced with 3 ml serum-free medium and continuously incubated for 48 h. A total of 50 μl of human sera (1:4 diluted) from PDAC patients or healthy individuals or 5 μl supernatants of cell culture were taken for ELISA analysis to measure the levels of THBS2 using a
Techniques: Biomarker Discovery, Quantitative Proteomics, Comparison, Expressing, Immunohistochemical staining, Staining, Clinical Proteomics, Concentration Assay
![Fig. 2. THBS2 was expressed by CAFs in KC mice and gradually increased with disease progression. (A) Venn diagram indicating the presence, absence or overlap of cancer cell-derived and stromal cell-derived proteins identified in a public dataset of human-to-mouse orthotopic xenograft tumors [21]. THBS2 belongs to the group of stromal cell-derived proteins (red asterisk). (B) A proteomics study identified the secretome of human pancreatic cancer cells (PCCs) and pancreatic stellate cells (PSCs) [22], and the datasets were compared with our TMT-based PDAC tissue quantitative proteome data and demonstrated that THBS2 (red asterisk) was spe cifically secreted by PSCs. (C) Histological analysis of pancreases from KC mice with different grades of PanIN lesions at 2 (PanIN-I), 4 (PanIN-II), 6 (PanIN-III) and 11 (PDAC) months of age by H&E staining (200×, scale bars: 100 μm). (D) Representative images of THBS2 (red), PDGFRα (purple) and EpCAM (green) mRNAs in pancreases from KC mice with different grades of pancreatic intraepithelial neoplasia (PanIN) lesions at 2 (PanIN-I), 4 (PanIN-II), 6 (PanIN-III) and 11 (PDAC) months of age by RNA in situ hybridization (RNA-ISH) analysis (scale bars: 30 μm). THBS2 transcriptional signals were located in the stromal cells (PDGFRα+, EpCAM– and DAPI+), not in PCCs (EpCAM+, PDGFRα– and DAPI+), and seems to be specifically secreted by stromal cells. (E) Representative images showing the expression of THBS2 and α-SMA proteins in pancreases from KC mice with different grades of PanIN lesions at 2 (PanIN-I), 4 (PanIN-II), 6 (PanIN-III) and 11 (PDAC) months of age by immunohistochemical staining (200×, scale bars: 100 μm). (For interpretation of the references to color in this figure legend, the reader is referred to the Web version of this article.)](https://pub-med-unpaywalled-images-cdn.bioz.com/pub_med_ids_ending_with_8892/pm34958892/pm34958892__page6_image1.jpg)
Journal: Cancer letters
Article Title: Tumor-stroma TGF-β1-THBS2 feedback circuit drives pancreatic ductal adenocarcinoma progression via integrin α v β 3 /CD36-mediated activation of the MAPK pathway.
doi: 10.1016/j.canlet.2021.12.025
Figure Lengend Snippet: Fig. 2. THBS2 was expressed by CAFs in KC mice and gradually increased with disease progression. (A) Venn diagram indicating the presence, absence or overlap of cancer cell-derived and stromal cell-derived proteins identified in a public dataset of human-to-mouse orthotopic xenograft tumors [21]. THBS2 belongs to the group of stromal cell-derived proteins (red asterisk). (B) A proteomics study identified the secretome of human pancreatic cancer cells (PCCs) and pancreatic stellate cells (PSCs) [22], and the datasets were compared with our TMT-based PDAC tissue quantitative proteome data and demonstrated that THBS2 (red asterisk) was spe cifically secreted by PSCs. (C) Histological analysis of pancreases from KC mice with different grades of PanIN lesions at 2 (PanIN-I), 4 (PanIN-II), 6 (PanIN-III) and 11 (PDAC) months of age by H&E staining (200×, scale bars: 100 μm). (D) Representative images of THBS2 (red), PDGFRα (purple) and EpCAM (green) mRNAs in pancreases from KC mice with different grades of pancreatic intraepithelial neoplasia (PanIN) lesions at 2 (PanIN-I), 4 (PanIN-II), 6 (PanIN-III) and 11 (PDAC) months of age by RNA in situ hybridization (RNA-ISH) analysis (scale bars: 30 μm). THBS2 transcriptional signals were located in the stromal cells (PDGFRα+, EpCAM– and DAPI+), not in PCCs (EpCAM+, PDGFRα– and DAPI+), and seems to be specifically secreted by stromal cells. (E) Representative images showing the expression of THBS2 and α-SMA proteins in pancreases from KC mice with different grades of PanIN lesions at 2 (PanIN-I), 4 (PanIN-II), 6 (PanIN-III) and 11 (PDAC) months of age by immunohistochemical staining (200×, scale bars: 100 μm). (For interpretation of the references to color in this figure legend, the reader is referred to the Web version of this article.)
Article Snippet: Cells were grown in a 6-cm cell culture dish (2 × 10⁶) for 24 h, and then, the cell medium was replaced with 3 ml serum-free medium and continuously incubated for 48 h. A total of 50 μl of human sera (1:4 diluted) from PDAC patients or healthy individuals or 5 μl supernatants of cell culture were taken for ELISA analysis to measure the levels of THBS2 using a
Techniques: Biomarker Discovery, Derivative Assay, Staining, RNA In Situ Hybridization, Expressing, Immunohistochemical staining

Journal: Cancer letters
Article Title: Tumor-stroma TGF-β1-THBS2 feedback circuit drives pancreatic ductal adenocarcinoma progression via integrin α v β 3 /CD36-mediated activation of the MAPK pathway.
doi: 10.1016/j.canlet.2021.12.025
Figure Lengend Snippet: Fig. 3. THBS2 was specifically expressed and secreted by CAFs in PDAC. (A) Representative images of H&E histology (up panel left two) and RNAscope multiplex fluorescent in situ hybridization (RNA-ISH, up panel right two and lower panel) of human PDAC tissues. The tumor and tumor-associated stroma areas are separated by dashed lines. The mRNA signals of THBS2 (red), PDGFRA (purple, fibroblast marker) and CK19 (green, epithelium marker) were revealed as punctate staining near the nuclei without background staining (scale bars: 60 or 10 μm). (B) The mRNA expression of THBS2 was positively correlated with ACTC2, PDGFRA, FN1 and FAP expression according to the RNA sequencing data in PDAC tissues from the Cancer Genome Atlas (TCGA) database. (C) Western blot analysis showed that THBS2 was expressed in different pancreatic cancer cells (PCCs) and CAFs (CCC-HPE-2 and HPaSteC) which were activated by pretreatment with conditioned medium (CM) of BxPC-3 cells or rhTGFβ. All experiments were performed in triplicate. (D) The secretion levels of THBS2 in different PCCs (AsPC-1, BxPC-3, CFPAC-1 and PANC-1) and CAFs were determined by ELISA. A total of 2 × 10⁶ cells were grown in a 6-cm cell culture dish for 24 h, and then the medium was replaced with 3 ml of serum- free medium and continuously incubated for 48 h. Then, 5 μl of supernatants of cell culture was taken for ELISA analysis to measure the levels of THBS2. Absorbance values were detected at 450 nm using a microplate reader and all experiments were performed in triplicate. (For interpretation of the references to color in this figure legend, the reader is referred to the Web version of this article.)
Article Snippet: Cells were grown in a 6-cm cell culture dish (2 × 10⁶) for 24 h, and then, the cell medium was replaced with 3 ml serum-free medium and continuously incubated for 48 h. A total of 50 μl of human sera (1:4 diluted) from PDAC patients or healthy individuals or 5 μl supernatants of cell culture were taken for ELISA analysis to measure the levels of THBS2 using a
Techniques: RNAscope, Multiplex Assay, In Situ Hybridization, Marker, Staining, Expressing, RNA Sequencing, Western Blot, Enzyme-linked Immunosorbent Assay, Cell Culture, Incubation

Journal: Cancer letters
Article Title: Tumor-stroma TGF-β1-THBS2 feedback circuit drives pancreatic ductal adenocarcinoma progression via integrin α v β 3 /CD36-mediated activation of the MAPK pathway.
doi: 10.1016/j.canlet.2021.12.025
Figure Lengend Snippet: Fig. 4. Pancreatic cancer cell-derived TGF-β1 induced the activation of pancreatic stellate cells and upregulatedTHBS2 expression by activating the p-Smad2/3 pathway. (A) Representative morphologies of activated pancreatic stellate cells (PSC) HPaSteC treated with pancreatic cancer cell (PCC) conditioned medium (20% BxPC-3 CM) or 20 ng/ml human TGF-β1 recombinant protein (rhTGF-β1) for 72 h (Scale bars: 30 μm). (B and C) The activation of HPaSteC cells was assessed by immunofluorescence staining (B) and Western blot analysis (C). After treatment with BxPC-3 CM or rhTGF-β1, the expression of THBS2 and the cancer associated fibroblast (CAF) marker α-SMA in HPaSteC cells was measured. The results indicated that HPaSteC cells were activated to CAFs. (D and E) Western blot analysis showed the expression of p-Smad2/3, Smad2/3, α-SMA and THBS2 in activated HPaSteC cells pretreated with 20% BxPC-3 CM or 20 ng/ml rhTGF-β1 alone or combined with 10 ng/ml TGF-β1 receptor inhibitors (SB525334 or SB431542) for 72 h. (F) Western blotting was used to assess the protein levels of p-Smad2/3, α-SMA and THBS2 in HPaSteC cells treated with BxPC-3 CM alone for 72 h or BxPC-3 CM blocked with anti-TGFβ1 neutralizing antibody. (G) The mRNA levels of THBS2 in HPaSteC cells treated or untreated with 20% BxPC-3 CM or 20 ng/ml rhTGF-β1 for 72 h were assessed by RT-PCR. The β-actin was used as a loading control in western bolts. The values are presented as the mean ± SD of three independent experiments. Ns: not significant; *p < 0.05; **p < 0.01 and ***p < 0.001 by Student’s t-test.
Article Snippet: Cells were grown in a 6-cm cell culture dish (2 × 10⁶) for 24 h, and then, the cell medium was replaced with 3 ml serum-free medium and continuously incubated for 48 h. A total of 50 μl of human sera (1:4 diluted) from PDAC patients or healthy individuals or 5 μl supernatants of cell culture were taken for ELISA analysis to measure the levels of THBS2 using a
Techniques: Derivative Assay, Activation Assay, Expressing, Recombinant, Immunofluorescence, Staining, Western Blot, Marker, Reverse Transcription Polymerase Chain Reaction, Control

Journal: Cancer letters
Article Title: Tumor-stroma TGF-β1-THBS2 feedback circuit drives pancreatic ductal adenocarcinoma progression via integrin α v β 3 /CD36-mediated activation of the MAPK pathway.
doi: 10.1016/j.canlet.2021.12.025
Figure Lengend Snippet: Fig. 7. Chemical inhibitors of integrin αvβ3/CD36 reversed the THBS2-induced proliferation, colony formation and adhesion of BxPC-3 cells. BxPC-3 cells were treated with 20% CAF-THBS2 CM/CAF-NC CM and 300 ng/ml rhTHBS2 for 12 h or pretreated with 100 nM integrin αvβ3 inhibitor SB273005 or 10 μg/ml anti-CD36 antibody for 6 h first and then treated with CAF-THBS2 CM/CAF-NC CM or rhTHBS2 for 12 h to perform the following experiments. CAF-THBS2 CM: conditioned medium of THBS2 overexpressing CAFs; CAF-NC CM: conditioned medium of CAFs alone as a control. (A, B) Cell proliferation was detected by the CCK-8 assay. SB/ SB273005: inhibitor of integrin αvβ3 receptor SB273005; Ab/Anti-CD36: anti-CD36 neutralizing antibody. (C) The colony formation assay was performed in BxPC-3 cells after pretreatment with CAF-THBS2 CM/CAF-NC CM, rhTHBS2 or chemical inhibitors of integrin αvβ3/CD36. rhTHBS2: recombinant human THBS2 protein. (D) The adhesion ability of BxPC-3 cells was measured after culturing for 60 min. All error bars represent the mean ± SD; ns: not significant; *p < 0.05; **p < 0.01 and ***p < 0.001.
Article Snippet: Cells were grown in a 6-cm cell culture dish (2 × 10⁶) for 24 h, and then, the cell medium was replaced with 3 ml serum-free medium and continuously incubated for 48 h. A total of 50 μl of human sera (1:4 diluted) from PDAC patients or healthy individuals or 5 μl supernatants of cell culture were taken for ELISA analysis to measure the levels of THBS2 using a
Techniques: Control, CCK-8 Assay, Colony Assay, Recombinant
Journal: Cell reports
Article Title: Chromosome silencing in vitro reveals trisomy 21 causes cell-autonomous deficits in angiogenesis and early dysregulation in Notch signaling
doi: 10.1016/j.celrep.2022.111174
Figure Lengend Snippet: (A) Diagram showing the close developmental relationship between hematopoietic and endothelial cell developmental pathways. Defects in hematopoietic lineage cells were characterized by . Areas of interest (i.e., production of EPCs from the hemangioblast and EC function) highlighted in red boxes. (B) Experimental schematic of endothelial cell differentiation and downstream assays. Dox is treated at day 0 of differentiation and the EPC population is assessed before purification. After purification, EPCs are matured and later tested for angiogenic function. (C) Representative flow analysis of CD31 + and CD34 + cell populations. Relevant CD31 + CD34 + endothelial progenitor cells are in quadrant 2. XIST − (red) and XIST + cells (blue) are overlaid. (D) Quantification of the CD31 + CD34 + population of each sample (−/+ dox; paired t test; means ± SDs). (E) Immunofluorescence staining of endothelial cell specific markers and RNA FISH of XIST (scale bar, 10 μm).
Article Snippet:
Techniques: Cell Differentiation, Purification, Immunofluorescence, Staining

Journal: Cell reports
Article Title: Chromosome silencing in vitro reveals trisomy 21 causes cell-autonomous deficits in angiogenesis and early dysregulation in Notch signaling
doi: 10.1016/j.celrep.2022.111174
Figure Lengend Snippet:
Article Snippet:
Techniques: Recombinant, Blocking Assay, Multiplex Assay, Isolation, Transgenic Assay, Software
Journal: bioRxiv
Article Title: Allelic and Gene Dosage Effects Involving Uromodulin Aggregates Drive Autosomal Dominant Tubulointerstitial Kidney Disease
doi: 10.1101/2022.09.13.507770
Figure Lengend Snippet: ( a ) Age at onset of kidney failure for ADTKD- UMOD patients with indicated UMOD mutations. Only mutations with at least 2 individuals reaching kidney failure at documented age are represented here. Two clusters of mutations associated with earlier-onset and later-onset kidney failure with two cluster-representative mutations (arrows, see result text) are highlighted. ( b ) Kaplan-Meier curve of kidney survival in patients with the UMOD p.Arg185Ser mutation ( N =9, median age at kidney failure: 42 years), the UMOD p.Cys170Tyr mutation ( N =9, median age at kidney failure: 69 years) and 60 ADTKD- UMOD patients from the Belgo-Swiss registry (see Material & Methods) with 24 different UMOD mutations (median age at kidney failure: 56 years). A log-rank test was used for comparison of survival curves. ( c ) Pedigrees of three multiplex families with ADTKD in which representative UMOD mutations p.Arg185Ser and p.Cys170Tyr have been identified. Females are represented by circles and males by squares and phenotypes denoted as indicated. Clinical features are detailed for each patient in Supplementary Tables 1-2. ( d ) Representative confocal analysis of uromodulin (UMOD, green), GRP78/BiP (red) and Picrosirius Red staining of kidney nephrectomy samples ADTKD- UMOD patients (p.Cys170Tyr – F1, II.1; p.Arg185Ser - IV.5). For immunofluorescence, nuclei were counterstained with DAPI (blue). Scale bar: 25 µm (top), 100 µm (bottom).
Article Snippet:
Techniques: Mutagenesis, Multiplex Assay, Staining, Immunofluorescence

Journal: bioRxiv
Article Title: Allelic and Gene Dosage Effects Involving Uromodulin Aggregates Drive Autosomal Dominant Tubulointerstitial Kidney Disease
doi: 10.1101/2022.09.13.507770
Figure Lengend Snippet: ( a ) Immunoblot analysis of uromodulin in kidneys from 1-month-old mutant mice, showing a distinct pattern for HMW bands. β-actin was used as a loading control. Densitometry analysis relative to core UMOD (M+P) ( n= 4 to 12 animals per group). M: mature; P: precursor; HMW: high molecular weight. ( b ) Immunofluorescence analysis of uromodulin and GRP78 (top) or CD-3 (middle) and picrosirius red staining on kidney sections from 4-month-old Umod KI mice ( n =3 to 11 animals per group). Scale bar: 25 µm for IF, 50 µm for Picrosirius red. Bars indicate mean ± SEM. One-way ANOVA with Tukey’s post hoc analysis, * P < 0.05, ** P < 0.01, # P < 0.0001. ( c ) Linear regression (black line) illustrating the correlation between UMOD aggregates and GRP78 intensity (left), CD-3 + infiltrates (middle) and interstitial fibrosis (right) in 4-month-old Umod KI mice. The dotted lines show the 95% confidence intervals. Dots indicate mean ± SEM. The equations for the curves are y= 0.1695x + 9.567 (left), y = 0.08372x + 4.203 (middle), y = 0.1073x + 1.915 (right).
Article Snippet:
Techniques: Western Blot, Mutagenesis, Molecular Weight, Immunofluorescence, Staining
Journal: Nature Communications
Article Title: Early-onset autoimmunity associated with SOCS1 haploinsufficiency
doi: 10.1038/s41467-020-18925-4
Figure Lengend Snippet: a Pedigrees of families with SOCS1 mutations. Squares: males; circles: females; black: affected mutation carriers; gray: unaffected mutation carriers. WT: wild-type SOCS1 allele. b Clinical manifestations in patients with SOCS1 mutations. Discoid lupus erythematosus (D1, upper left), active lupus nephritis (E1, lower left) with segmental cellular crescent associated with mesangial hypercellularity (Masson’s trichrome × 400) and glomerular capillary wall and mesangial C1q deposition by immunofluorescence microscopy, abdominal MRI showing splenomegaly (C1, middle), and plaque, intertrigous and guttata psoriasis (E4, right). c SOCS1 protein domains and locations of the mutations (upper panel, black arrows). The kinase inhibitory region (KIR) functions as a pseudosubstrate that can inhibit the tyrosine kinase activity of Janus kinase (JAK) proteins. The SRC-homology 2 (SH2) domain binds the activation loop of the JAK proteins’ catalytic domain. The SOCS box recruits the ubiquitin-transferase system and initiates the proteasomal degradation of JAK proteins. The SOCS1 M161Afs*46 mutant leads to a predicted 46-residue neopeptide in the SOCS box domain three amino acids shorter than the wild-type protein (lower panel). d Top panel: position of the P123 and Y154 in human SOCS1 within a 3D model of the JAK1/SOCS1 complex. Bottom panel: a model of the human SOCS1’s SH2 domain. The two mutated amino acids (P123R and Y154H) are highlighted in the phosphotyrosine peptide binding groove (the pY and pY+3 pockets). The possible location of a phosphotyrosine peptide is shown in purple. e SOCS1 protein expression in patient-derived cells and transfected cells. Top : Western blot (WB) analysis of lysates from Epstein-Barr-virus (EBV)-tranformed B cells from patients A1, B2, and D1 and from two healthy controls (CT1 and CT2), following incubation with anti-SOCS1 antibodies (upper panel) or anti-actin antibodies as a loading control (lower panel). Bottom: HEK293T cells transiently transfected with an empty vector (EV), a vector coding for hemagglutinin (HA)-tagged wild-type (WT) SOCS1 protein, or vectors coding for the five HA-tagged mutant SOCS1 proteins. Lysates were incubated with anti-HA antibodies (upper panel) or anti-actin antibodies as a loading control (lower panel). Data are representative of two independent experiments.
Article Snippet: The indicated
Techniques: Mutagenesis, Immunofluorescence, Microscopy, Activity Assay, Activation Assay, Ubiquitin Proteomics, Residue, Binding Assay, Expressing, Derivative Assay, Transfection, Western Blot, Virus, Incubation, Control, Plasmid Preparation

Journal: Nature Communications
Article Title: Early-onset autoimmunity associated with SOCS1 haploinsufficiency
doi: 10.1038/s41467-020-18925-4
Figure Lengend Snippet: Clinical phenotype of patients with SOCS1 mutations.
Article Snippet: The indicated
Techniques:

Journal: Nature Communications
Article Title: Early-onset autoimmunity associated with SOCS1 haploinsufficiency
doi: 10.1038/s41467-020-18925-4
Figure Lengend Snippet: Cytokine array analysis of serum from patients with SOCS1 insufficiency, controls, patients with STAT1 GOF mutations, and patients with STAT3 GOF mutations. Gray: symptomatic patients; white: asymptomatic carriers. Decimal logarithms of the values determined in a multiplex bead assay were color-coded as follows: for each individual cytokine, median values obtained in the 17 HCs were defined as 0 (white). The X-fold standard deviation above this median (0 to +4, coded in red) or below this median (0 to −4, coded in blue) is shown with the individual squares. The color code was arbitrarily truncated at ±4 SDs.
Article Snippet: The indicated
Techniques: Multiplex Assay, Standard Deviation

Journal: Nature Communications
Article Title: Early-onset autoimmunity associated with SOCS1 haploinsufficiency
doi: 10.1038/s41467-020-18925-4
Figure Lengend Snippet: a , b Left: Western blots (WB) of patients (A1, B2, and D1) and healthy controls (CT) derived EBV-B cells stimulated with IFN-γ (10 3 IU/ml for 1 h) ( a ) or IL-2 (10 4 IU/ml for 2 h) ( b ). Lysates were incubated with an antibody against tyrosine-phosphorylated STAT (P-STAT) or against total STAT, as indicated. Right: densitometric quantification of the phospho-STAT/α-tubulin or β-actin ratio upon stimulation. a, b Data are representative of n = 3 (patients B2 and D1), n = 4 (A1, IL-2 stimulation), and n = 6 (A1, IFNγ stimulation) independent experiments. Statistics (versus CT2): IFNγ stimulation, A1 p = 0.0008, B1 p = 0.0029, D1 p = 0.0002; IL-2 stimulation, A1 p < 0.0001, B1 p = 0.0118, D1 p < 0.0001. c The nuclear and cytoplasmic fractions of EBV-B cells from a control (CT) and from patient A1 after stimulation with IFN-γ for 1 h (left) or with IL-2 for 2 h (right) were tested by WB for the presence of P-STAT1 and P-STAT5, respectively. Anti-lamin A/C and anti-α-tubulin antibodies were used to normalize the amount of nuclear and cytoplasmic proteins. Data are representative of two independent experiments. d Real-time quantitative RT-PCR assays of CXCL9 and CXCL10 expression 6 h after stimulation with IFN-γ (left), and assays of CISH and PIM1 expression 6 h after stimulation with IL-2 (right) in EBV-B cells from a CT and from patient A1. Results represent the fold-increased expression between stimulated and unstimulated states and are normalized to endogeneous GAPDH. Data are representative of n = 3 (IL-2 stimulation) and n = 4 (IFNγ stimulation) independent experiments performed in triplicate. Statistics: IFNγ stimulation, CXCL9 p = 0.0094, CXCL10 p = 0.0063; IL-2 stimulation, PIM1 p = 0.0105, CISH p = 0.0008. e Firefly luciferase activity in HEK293T cells transiently transfected with a gamma-activated sequence-driven IFN-γ reporter plasmid (GAS) and expression plasmids for WT or mutant SOCS1 proteins, and then stimulated with IFN-γ for 24 h. The results correspond to the fold-difference between the stimulated state and the unstimulated state. Results represent at least n = 4 independent experiments. All constructs were compared with WT SOCS1. Protein expression from the transfected plasmids was confirmed by immunoblotting the cell lysates (below, one representative result). Statistics: EV p < 0.0001, P123R p < 0.0001, A9FS*76 p < 0.0001, M161FS*46 p < 0.0001, R22W p = 0.0011, Y154H p = 0.0009. a , b , d , e Two-tailed p values were determined in an unpaired t est. Data indicate mean with SD. * P ≤ 0.05; ** P ≤ 0.01; *** P ≤ 0.001; **** P ≤ 0.0001.
Article Snippet: The indicated
Techniques: Western Blot, Derivative Assay, Incubation, Control, Quantitative RT-PCR, Expressing, Luciferase, Activity Assay, Transfection, Sequencing, Plasmid Preparation, Mutagenesis, Construct, Two Tailed Test